
Executive Summary
196 Virginia families were served by 10 Functional Family Therapy (FFT) teams from October to December 2025. Of the 82 closed cases, 83% of youth were living in the community at discharge and 83% were in school or working, just under the FFT, LLC benchmark. Average final fidelity across the state was 4.12, well above the threshold of 3.0. Eight of nine teams with available fidelity scores were above this threshold.
One area of attention for state leadership is sustaining the service as teams close. This quarter, the number of families served dropped below 200 for the first time since the second quarter of 2023.
Service Coverage Area
Figure 1. Provider-reported Service Coverage Areas
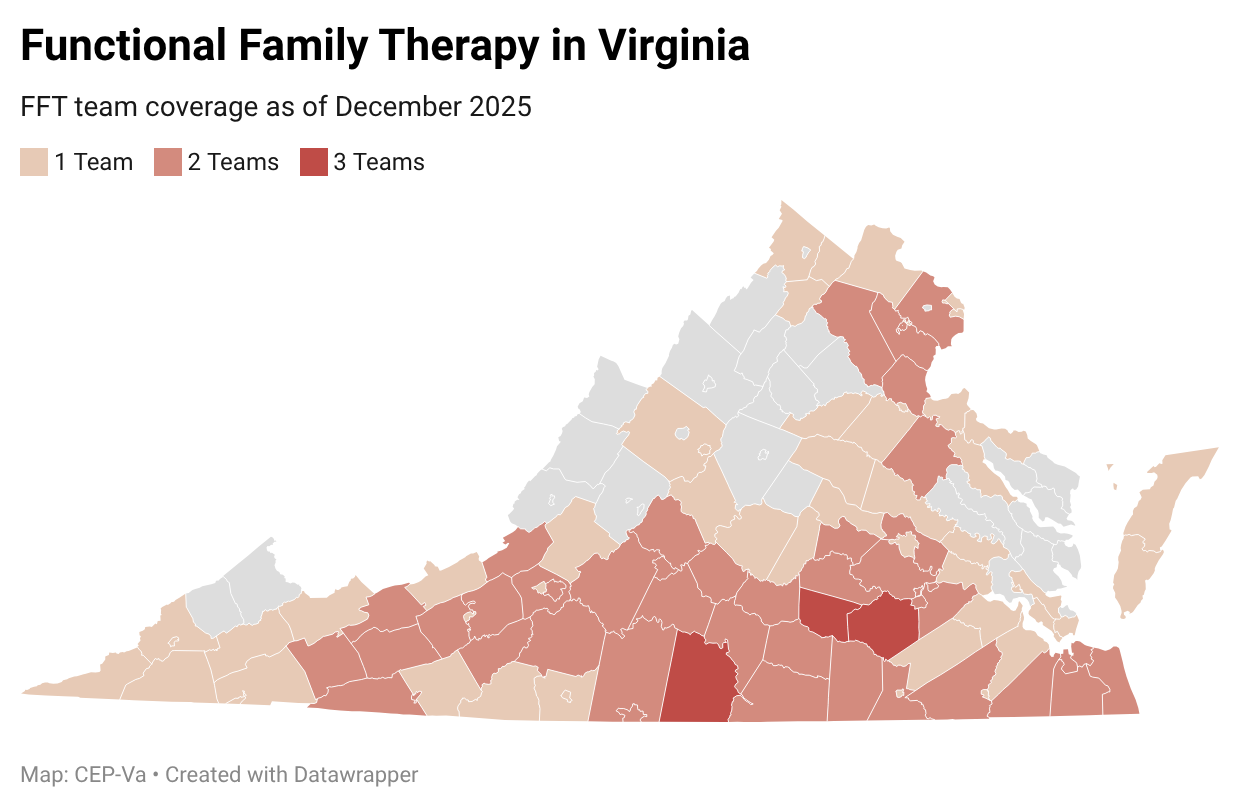
Figure 1 displays the areas in the state covered by open and staffed FFT teams. This data is collected quarterly from provider agencies and reflects the localities from which teams can accept FFT referrals.
Historical Status of Virginia FFT Team Workforce and Caseloads
Team and Case Data
Figure 2. Active Teams with Average Caseload Across Virginia
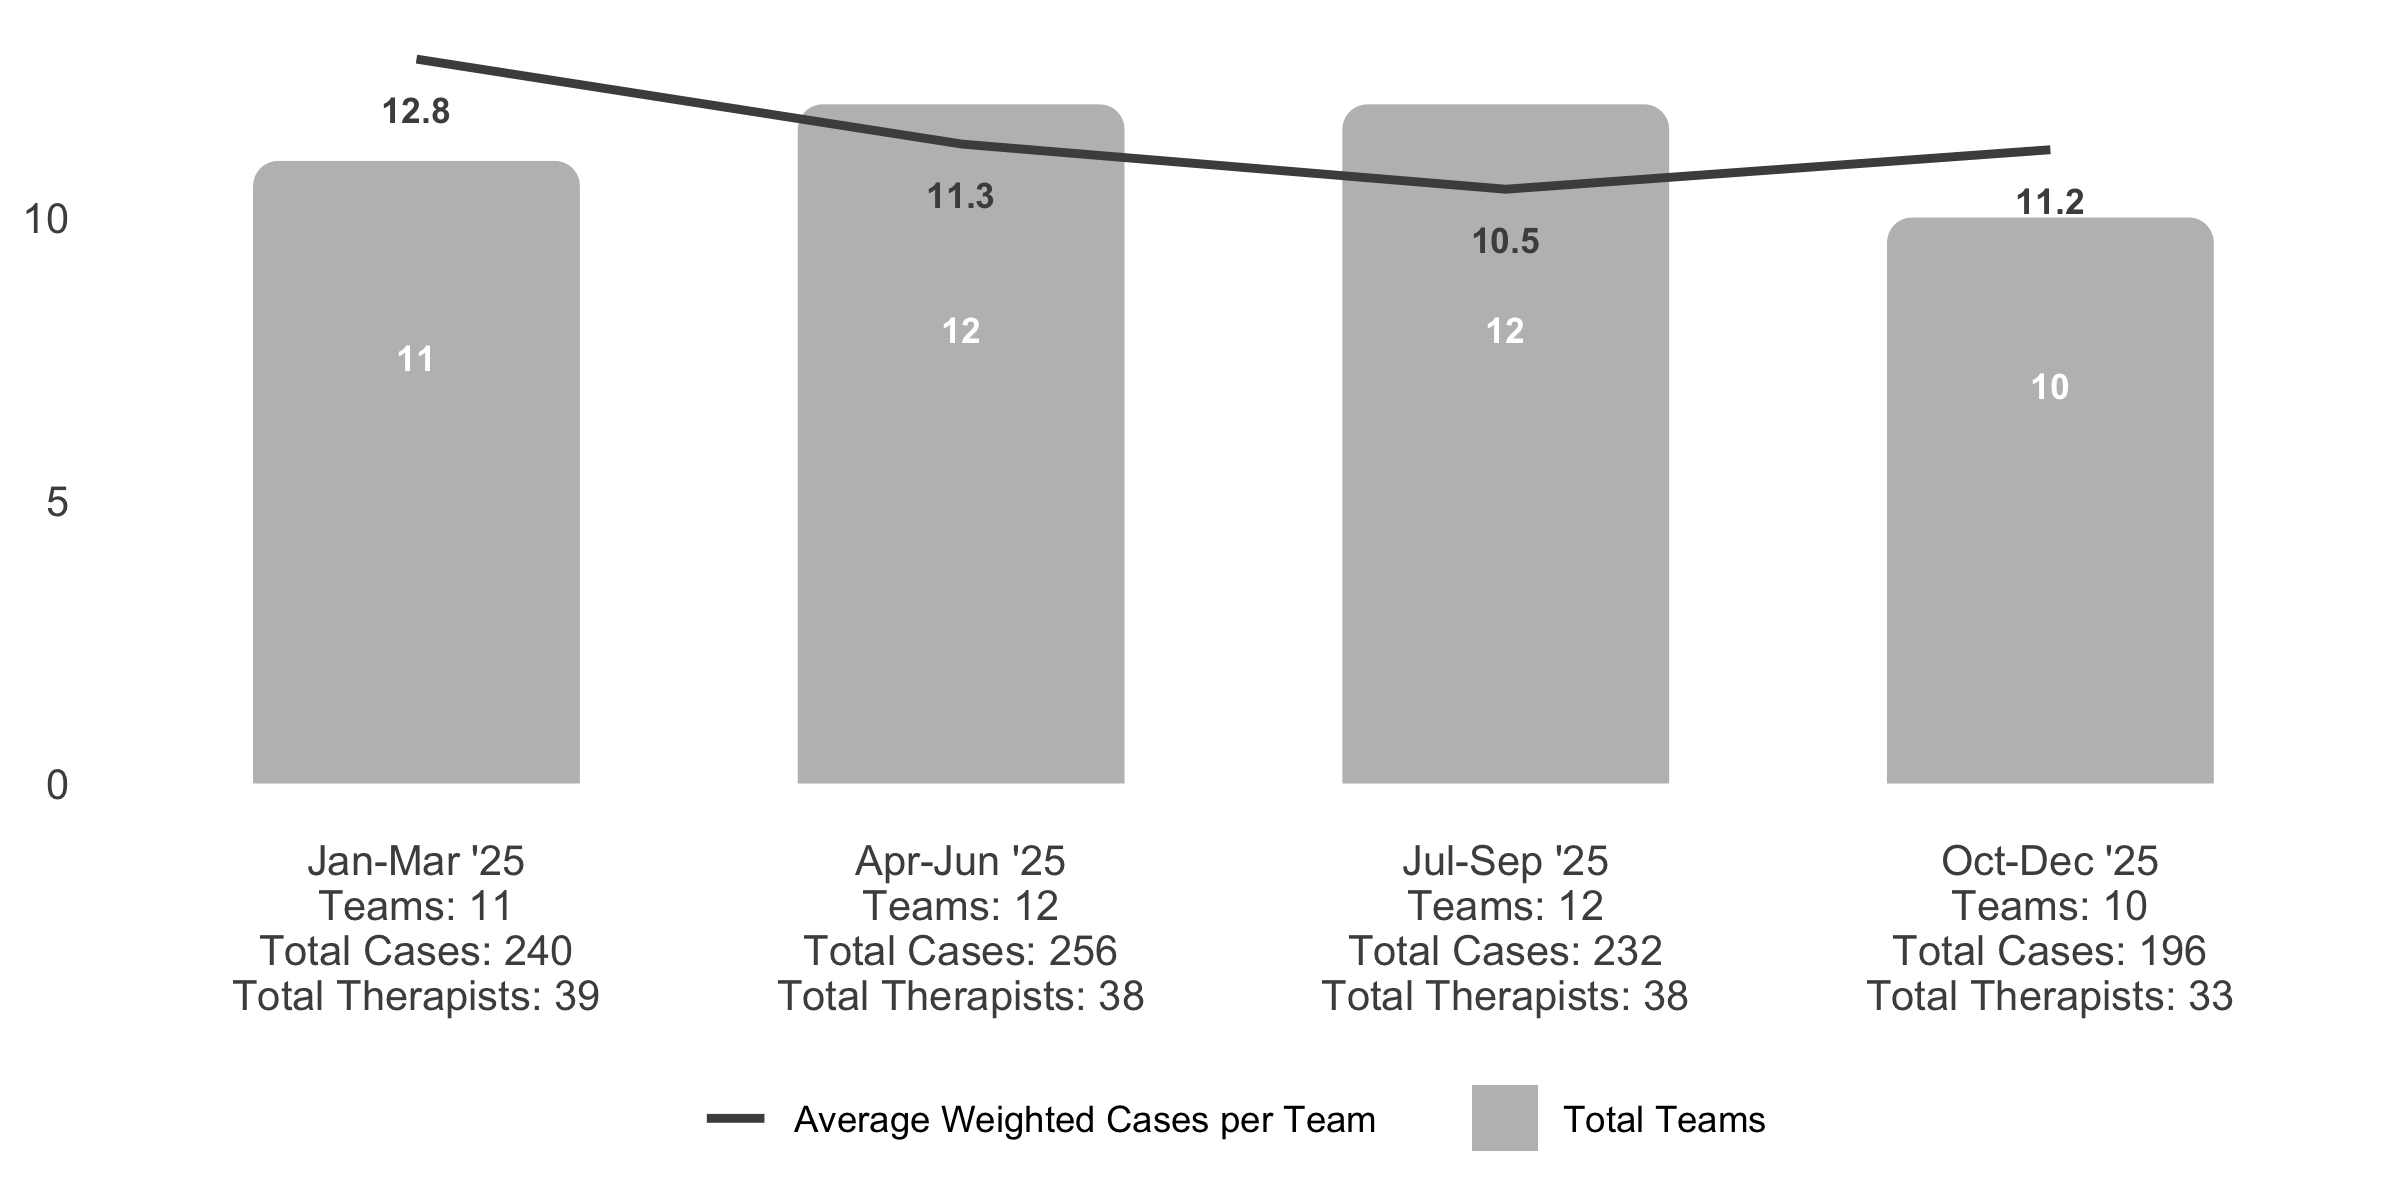
One team closed at the end of December 2025, thus by the end of the quarter only 9 total teams were operating (charts in this report will reference 10 teams, as they were open for a majority of the period). While the average number of active cases per team rose slightly, as seen in Figure 2, the total number of families served dropped meaningfully.
See Table 1 for a more detailed breakdown of teams across quarters.
Table 1. Team Status Detail
| Quarter | Teams operating | New teams | Closed teams |
|---|---|---|---|
| Jul-Sep 2021 | 9 | 0 | 0 |
| Oct-Dec 2021 | 9 | 0 | 0 |
| Jan-Mar 2022 | 10 | 1 | 0 |
| Apr-Jun 2022 | 9 | 0 | 1 |
| Jul-Sep 2022 | 9 | 0 | 0 |
| Oct-Dec 2022 | 9 | 0 | 0 |
| Jan-Mar 2023 | 9 | 1 | 1 |
| Apr-Jun 2023 | 9 | 0 | 0 |
| Jul-Sep 2023 | 10 | 1 | 0 |
| Oct-Dec 2023 | 10 | 0 | 0 |
| Jan-Mar 2024 | 10 | 0 | 0 |
| Apr-Jun 2024 | 10 | 0 | 0 |
| Jul-Sep 2024 | 11 | 0 | 0 |
| Oct-Dec 2024 | 11 | 0 | 0 |
| Jan-Mar 2025 | 11 | 0 | 0 |
| Apr-Jun 2025 | 12 | 1 | 0 |
| Jul-Sep 2025 | 10 | 0 | 2 |
| Oct-Dec 2025 | 9 | 0 | 1 |
Full-time Therapists
Figure 3. Average Number of Team Therapists
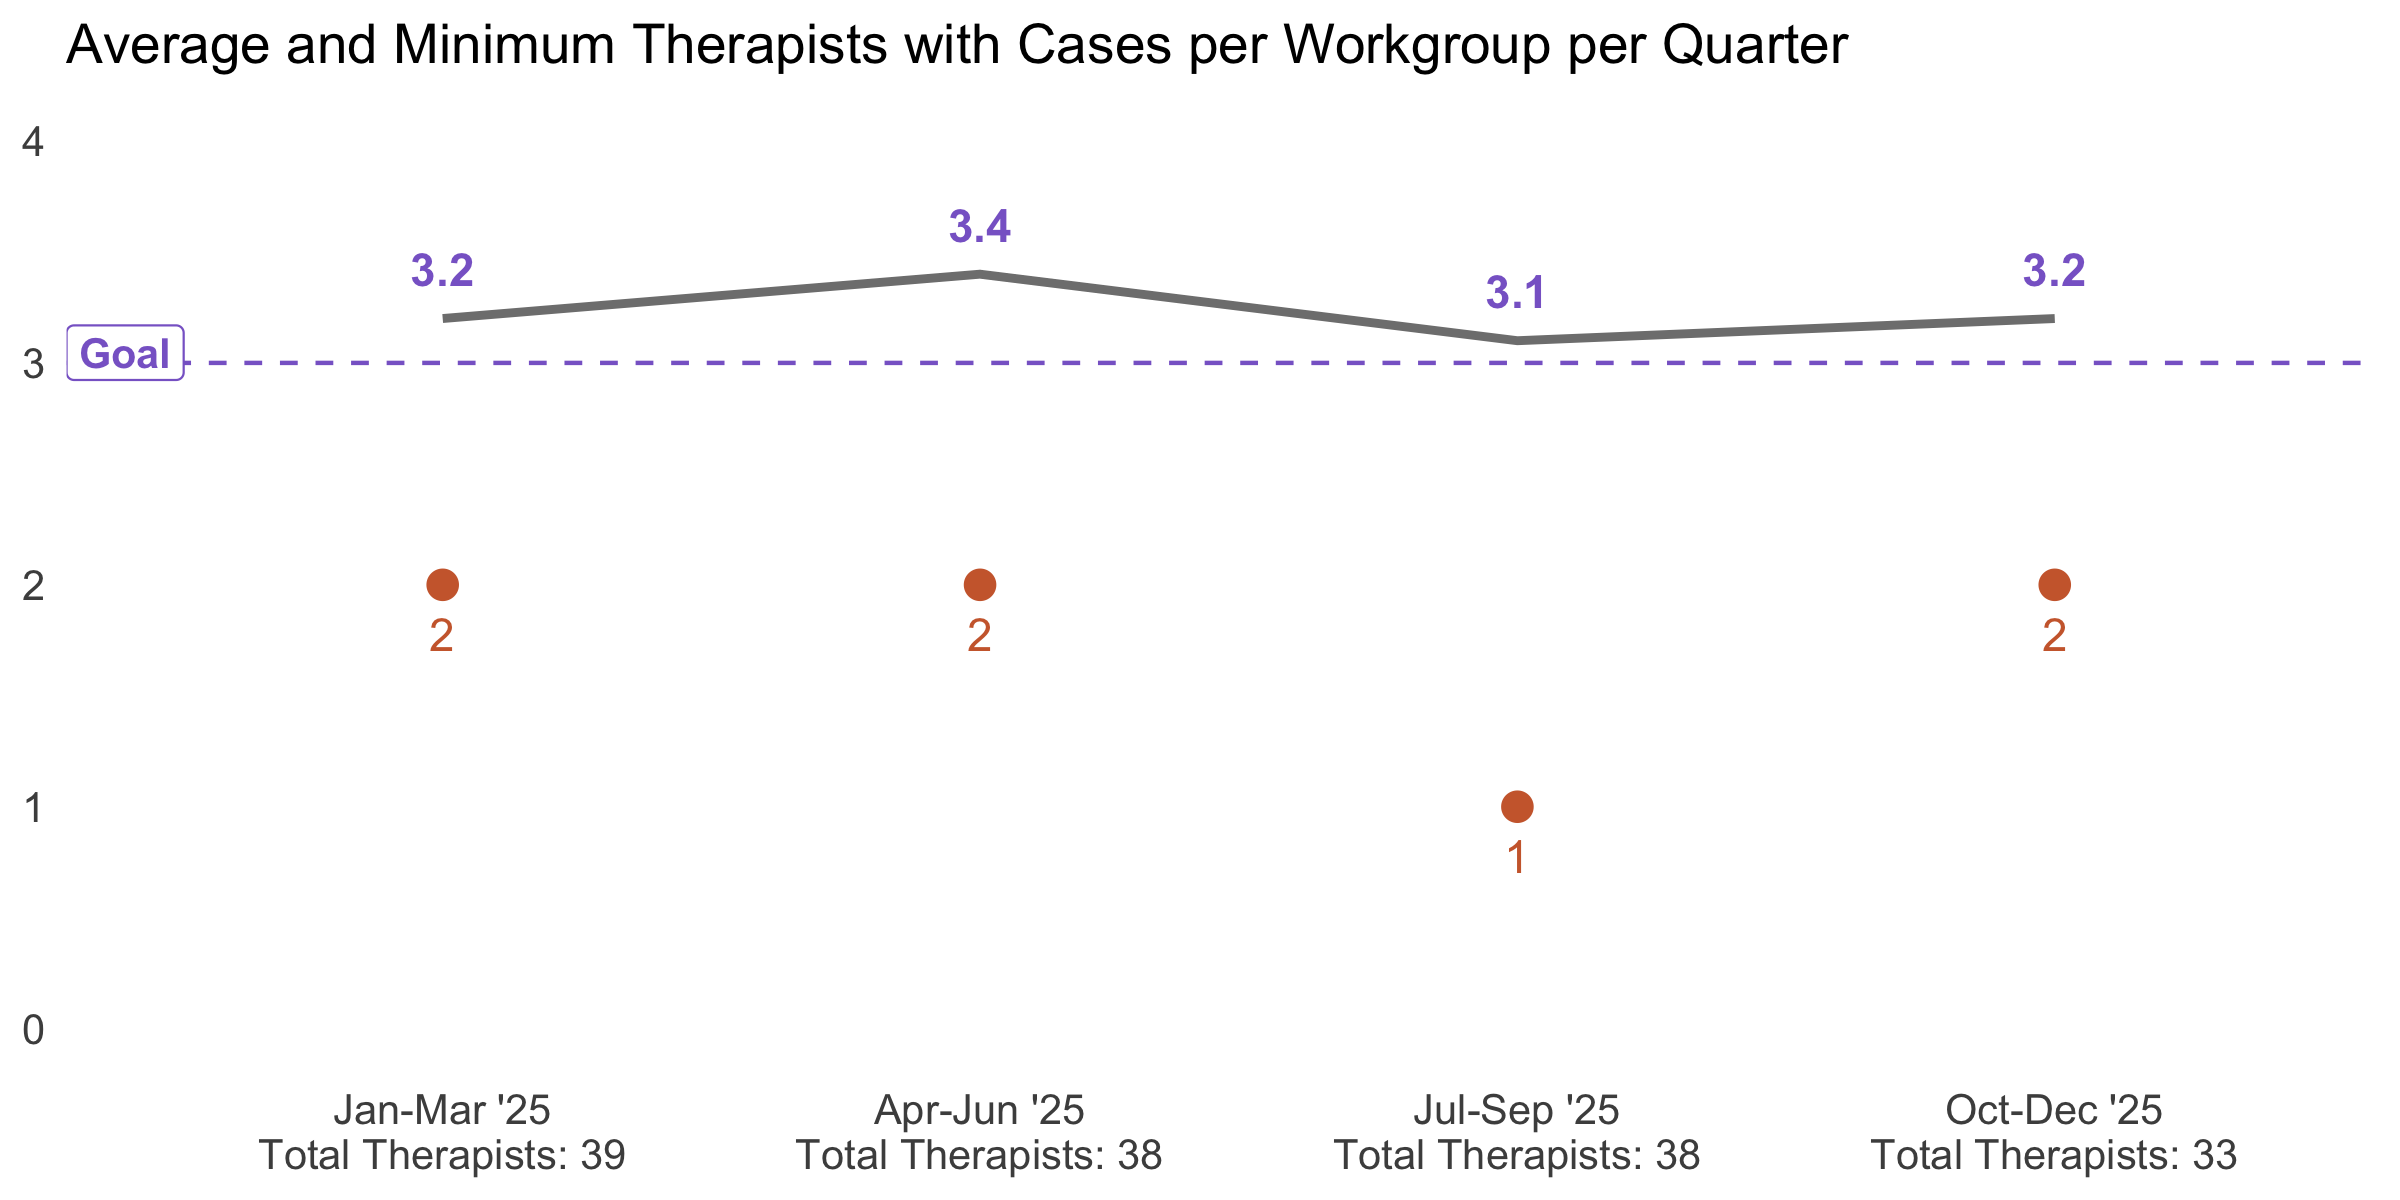
FFT, LLC, the training organization for the model, has set a target of three therapists per team, represented by the lavender dashed line in Figure 3. In Q4 2025, the average number of therapists per team, weighted for the number of days they served on the team in the quarter and removing supervisors who don’t carry cases, was 3.2. The orange dots represent the team with the lowest number of therapists for each reporting period.
Cases per Therapist
Figure 4. Average Number of Cases per Therapist
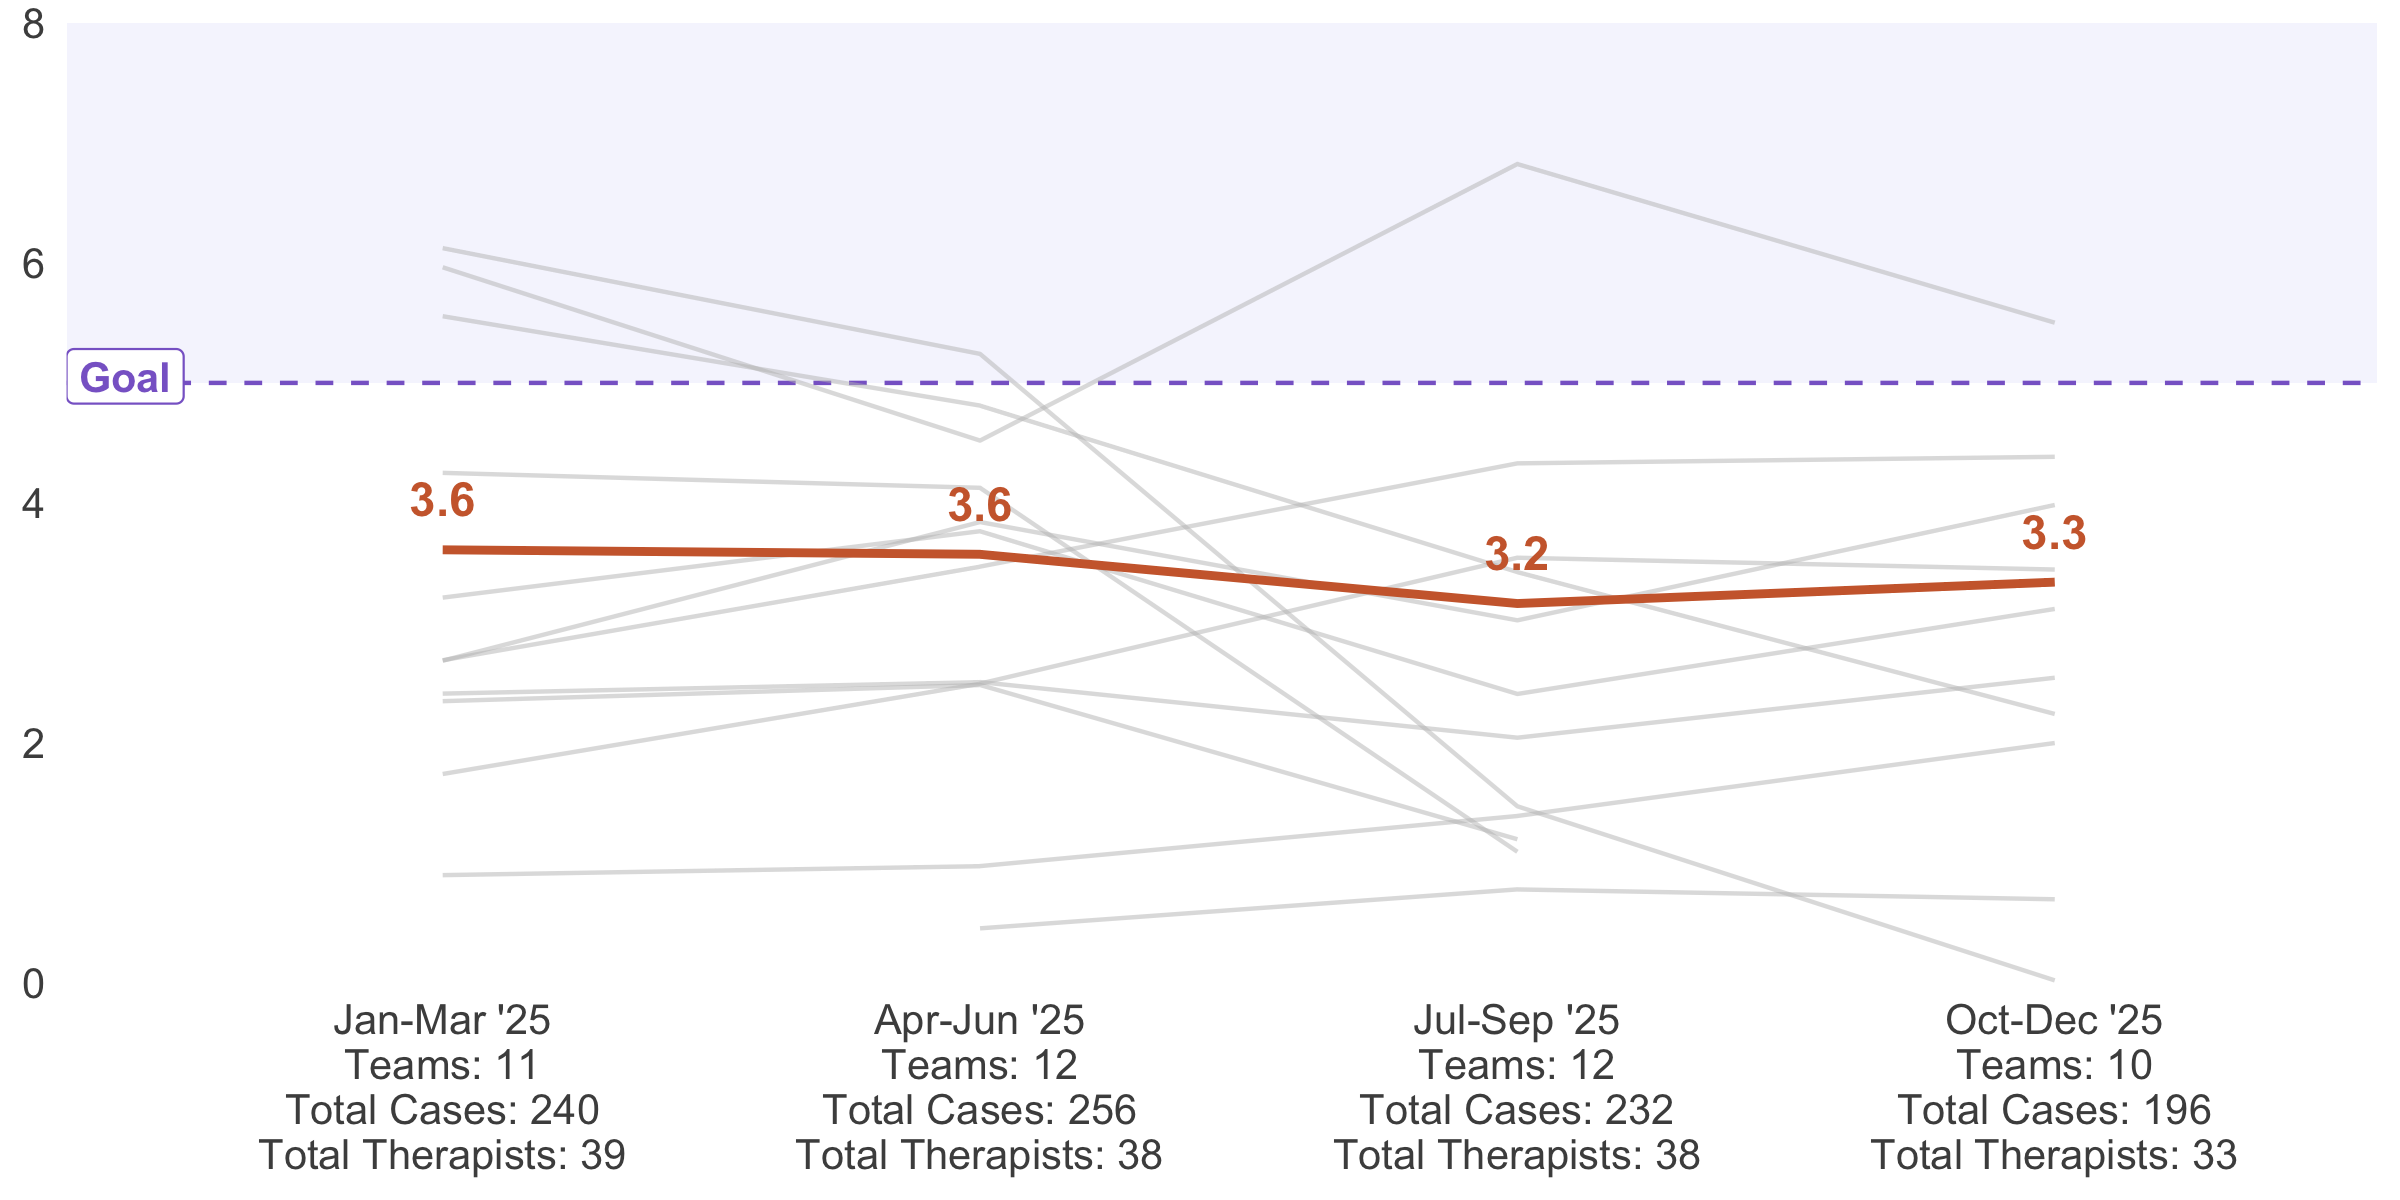
FFT, LLC expects therapists to carry a caseload between 5 and 15 cases, as represented by the lavender dashed line. Figure 4 depicts each team’s average number of cases per therapist (gray lines), and the average across the state (orange line).
Cases are weighted by the number of days the case was active in the quarter.
Measure of Final Fidelity using Clinical Adherence and Clinical Competence Ratings
Fidelity Scores Across Teams
Figure 5. Average Final Fidelity Scores Across Virginia Teams
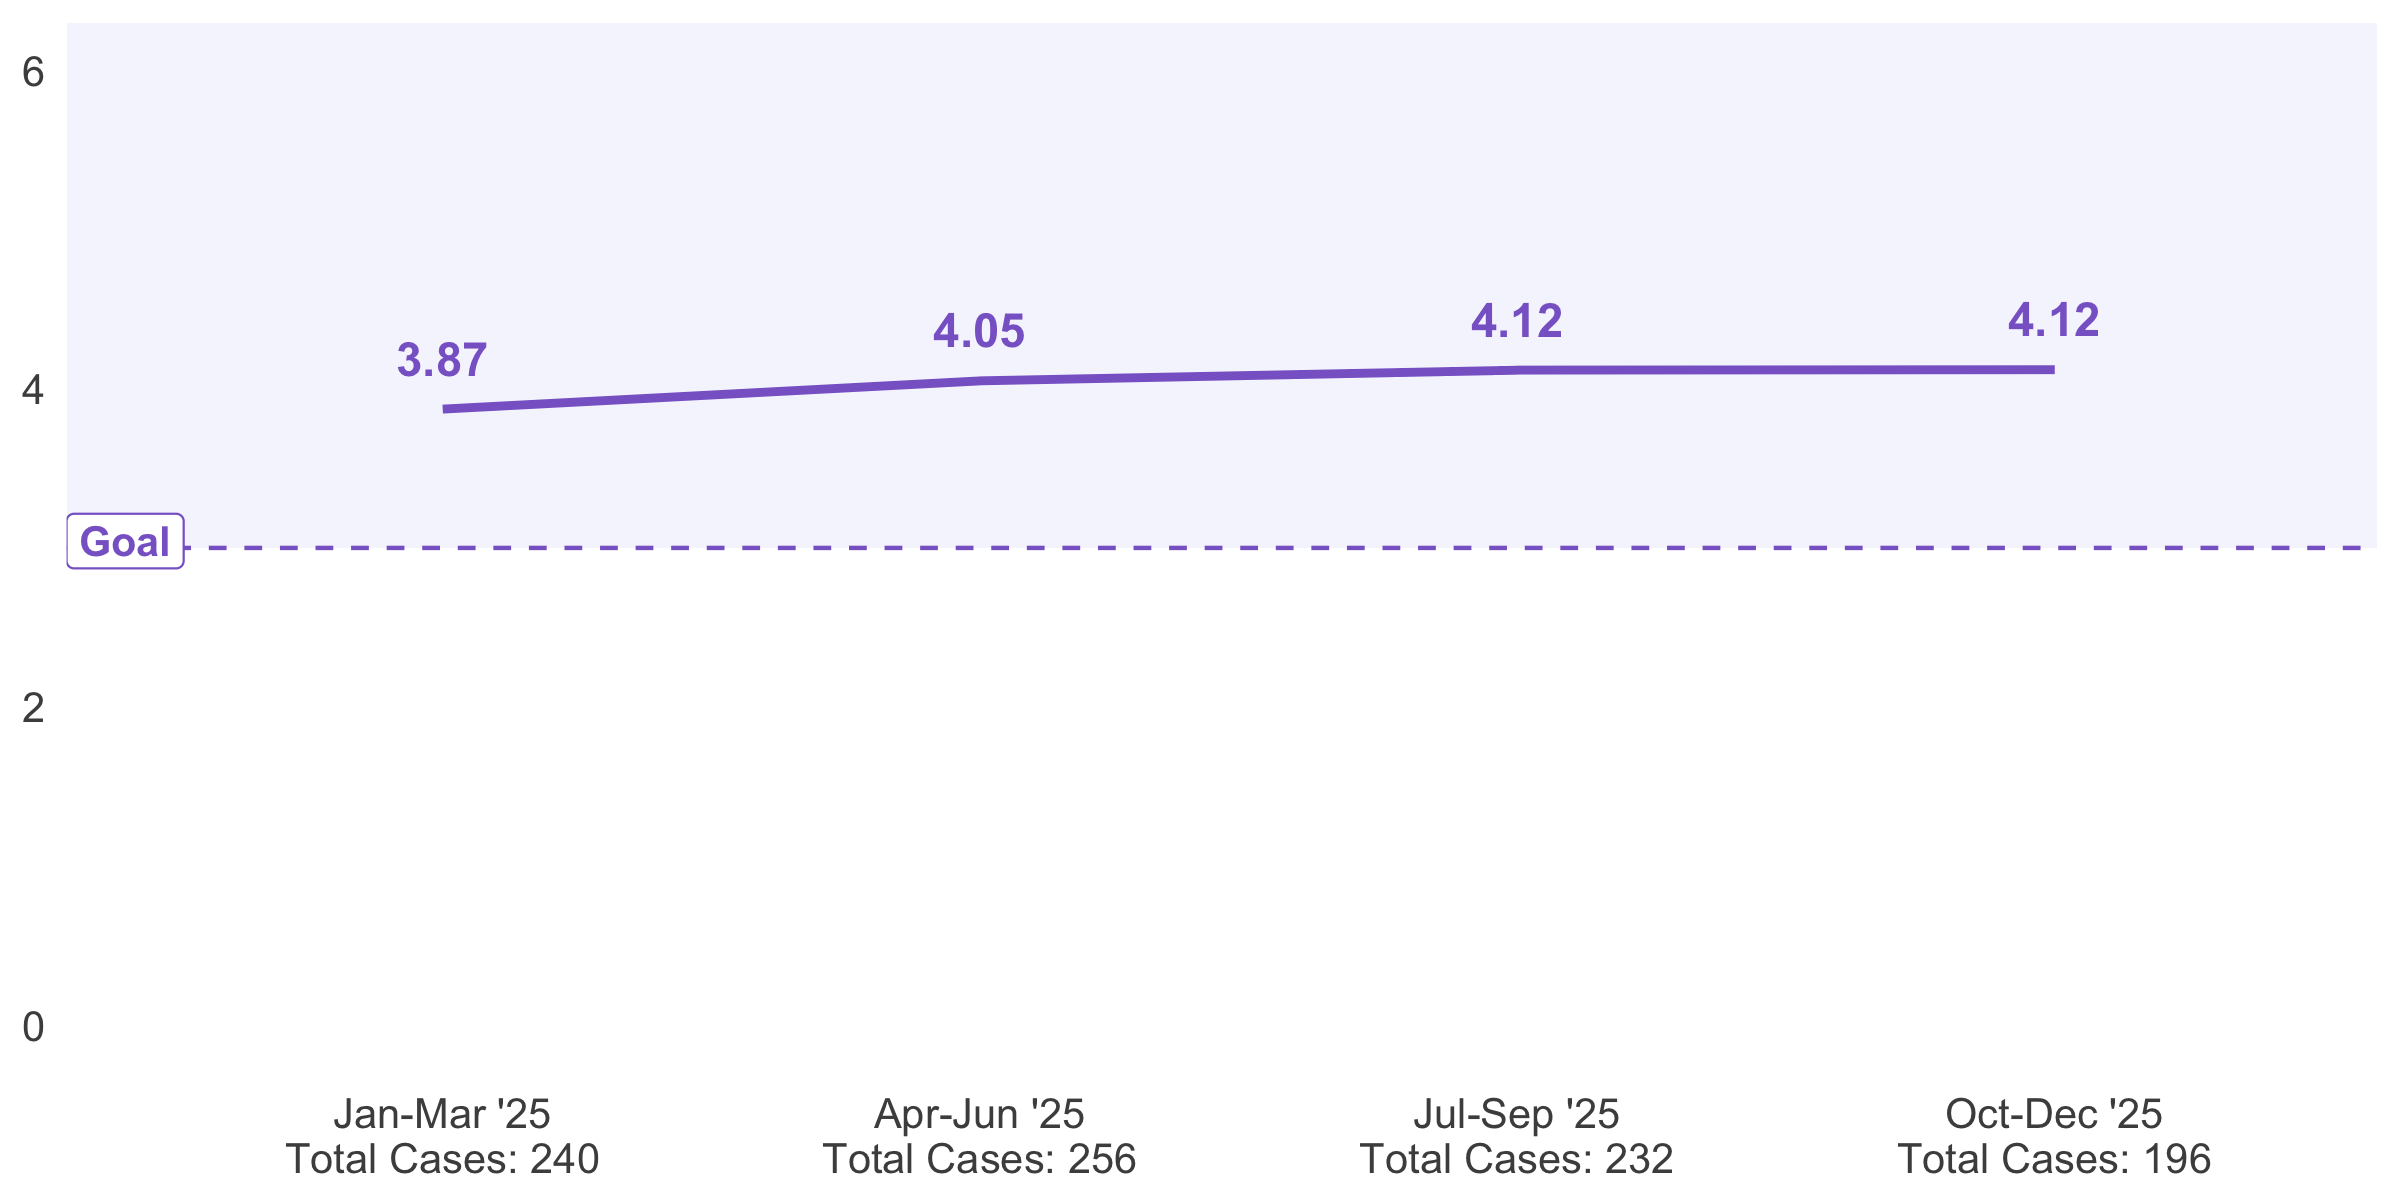
The final fidelity score is a combination of a clinician’s clinical adherence score, or how well the clinician applies the model components in the proper sequence, with the clinical competence score, or how skillfully the clinician applies the model. These ratings are given by supervisors during weekly case reviews, with an acceptable level of fidelity considered 3.0 or greater (on a 6-point scale), represented by the lavender area in Figure 5. The average fidelity score of all cases in the state for each quarter is depicted by the purple line, which remained 4.12.
From October to December, 8 of 9 teams with available fidelity data maintained an average fidelity above the threshold.
Outcome Measures
Data for all families are included whether or not their treatment was completed in a planned fashion. Exceptions to this include cases withdrawn for funding reasons, cases where the family moved out of the service area, cases where referral sources referred a case elsewhere, or with placements that resulted from actions carried out before the start of treatment. Cases for which the status of these outcome measures was recorded as “unknown/not applicable” are also included in these calculations.
Remaining in Community
Figure 6. Percent of VA Youth Remaining in Community
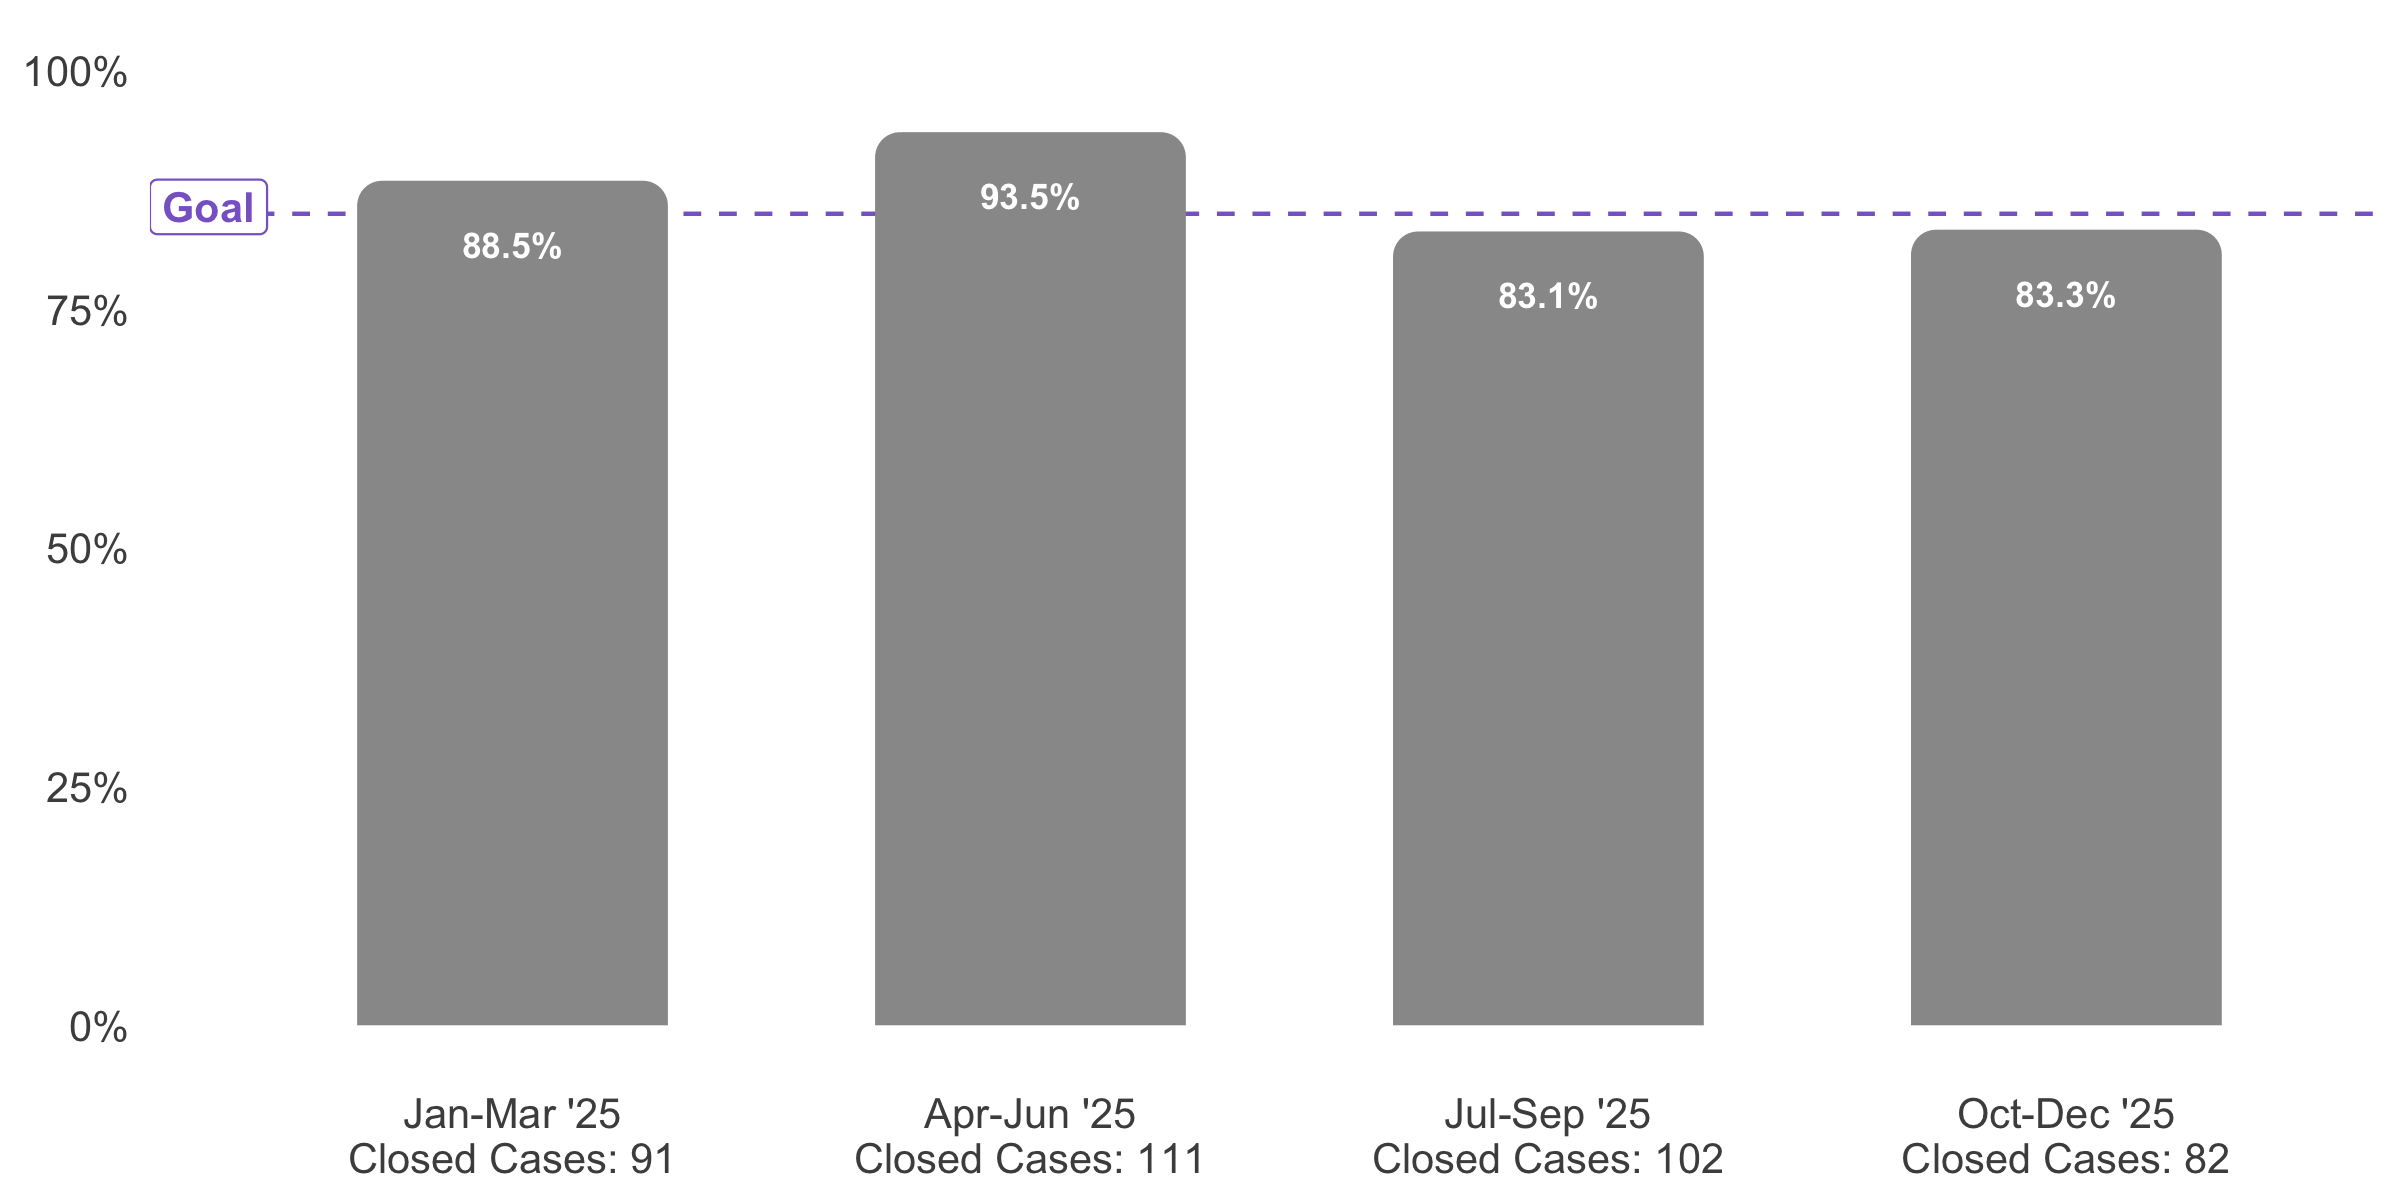
FFT, LLC defines remaining in community as not being placed formally outside of the home (group home, foster home, addiction treatment facility) but may be living with a relative in the community. This quarter, 83% of youth who completed treatment were known to be living in the community at time of discharge.
Attending School
Figure 7. Percent of VA Youth Attending School
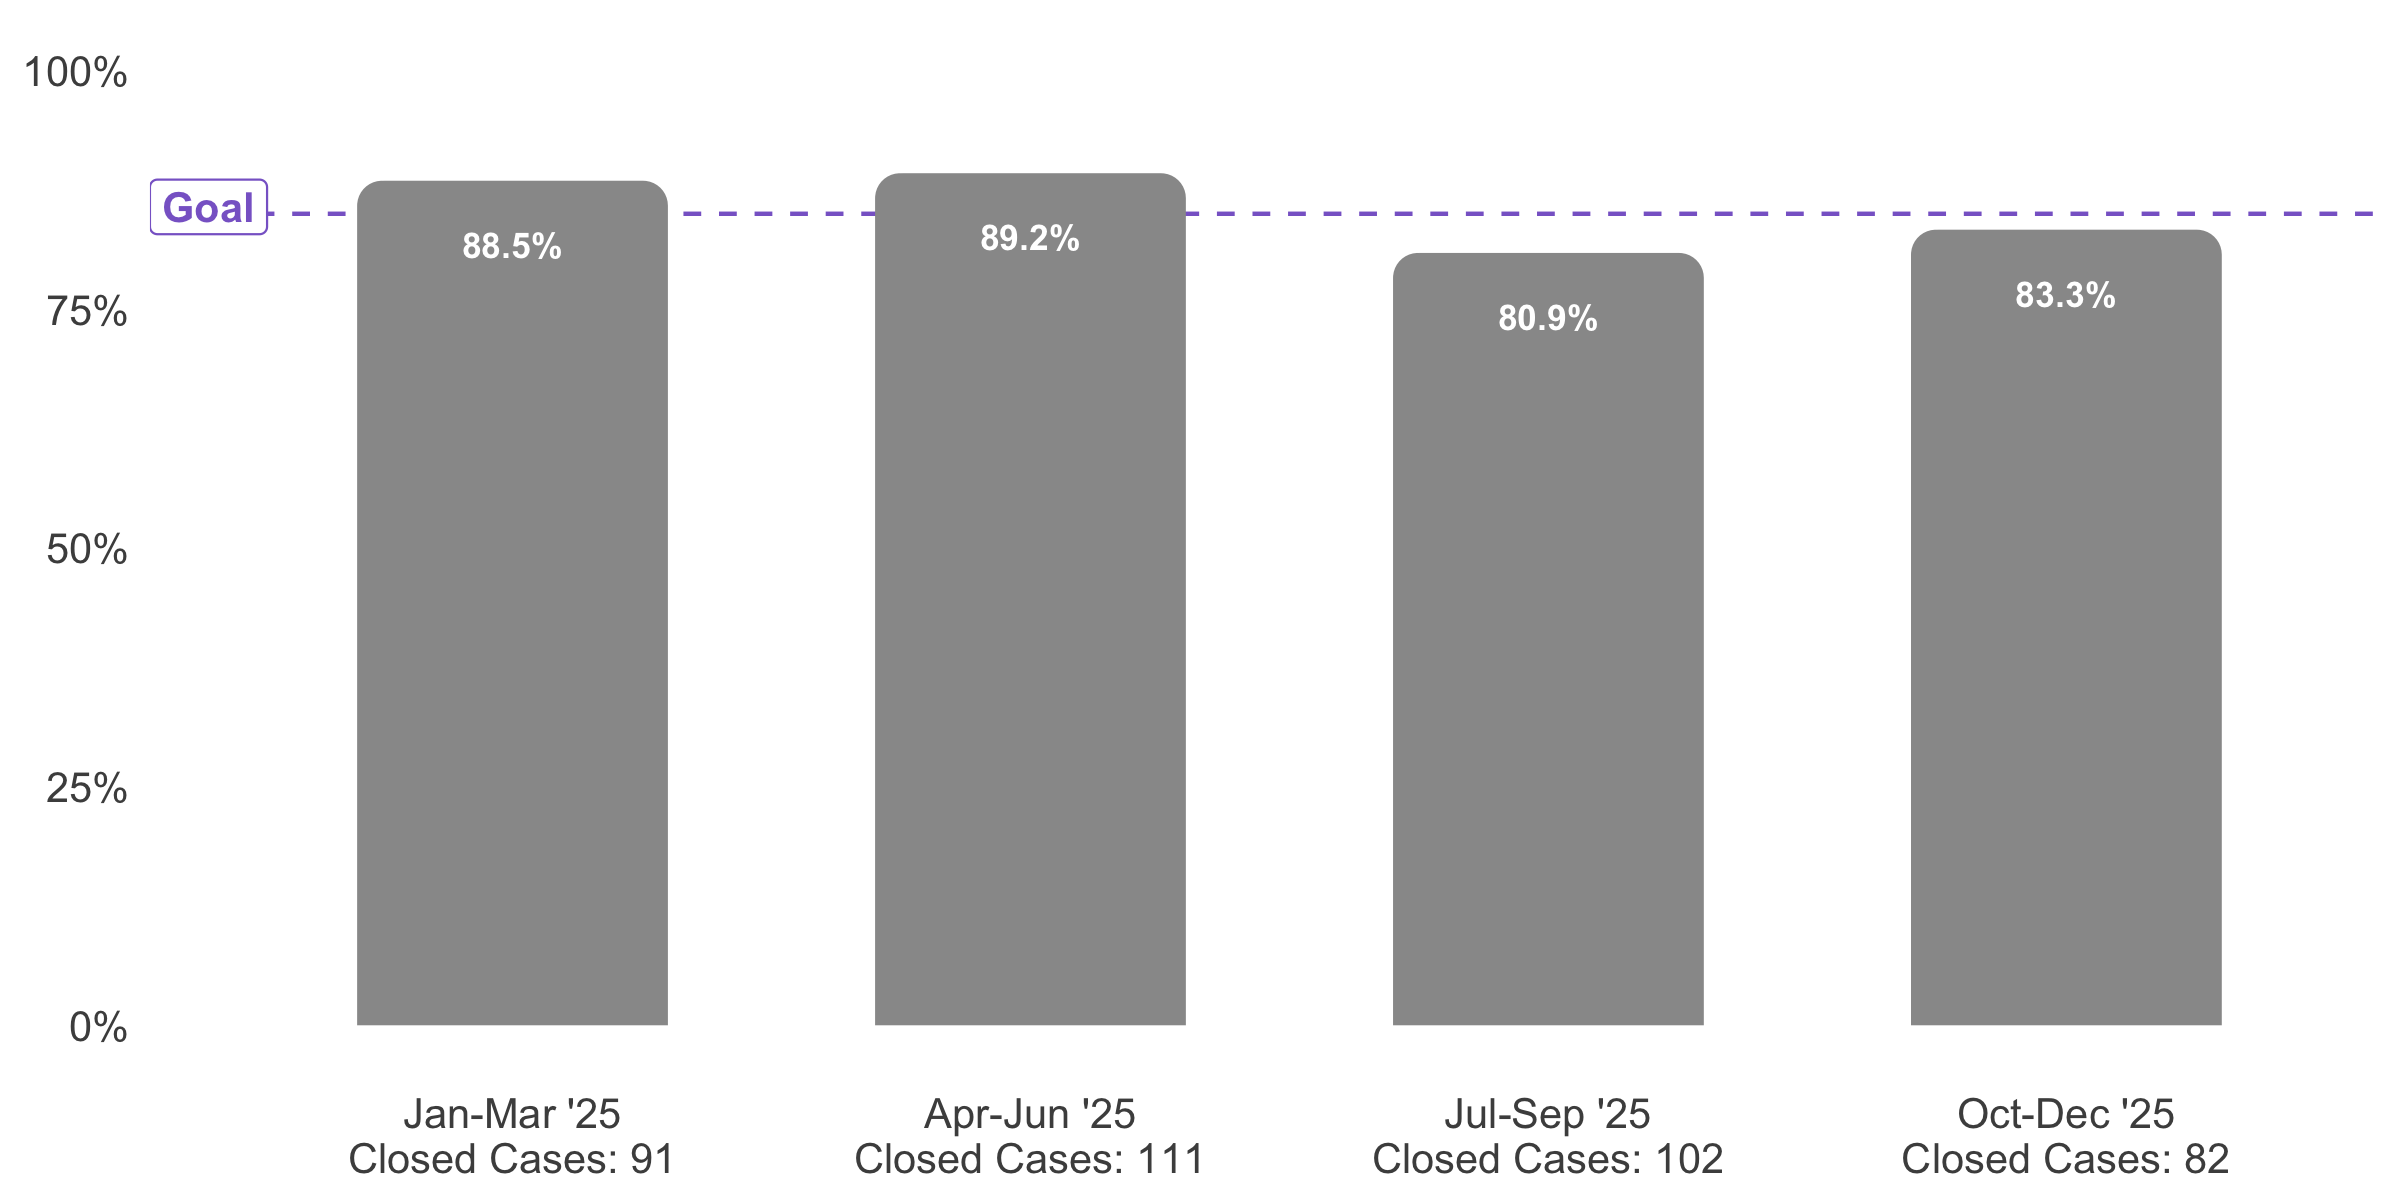
For this indicator, a youth is included if they are attending school or vocational programs, or intend to (in the cases of summer or applying to college). The reported share of known youth attending school or work this quarter was 83%.
Law Violations
Figure 8. Percent of VA Having No New Law Violations
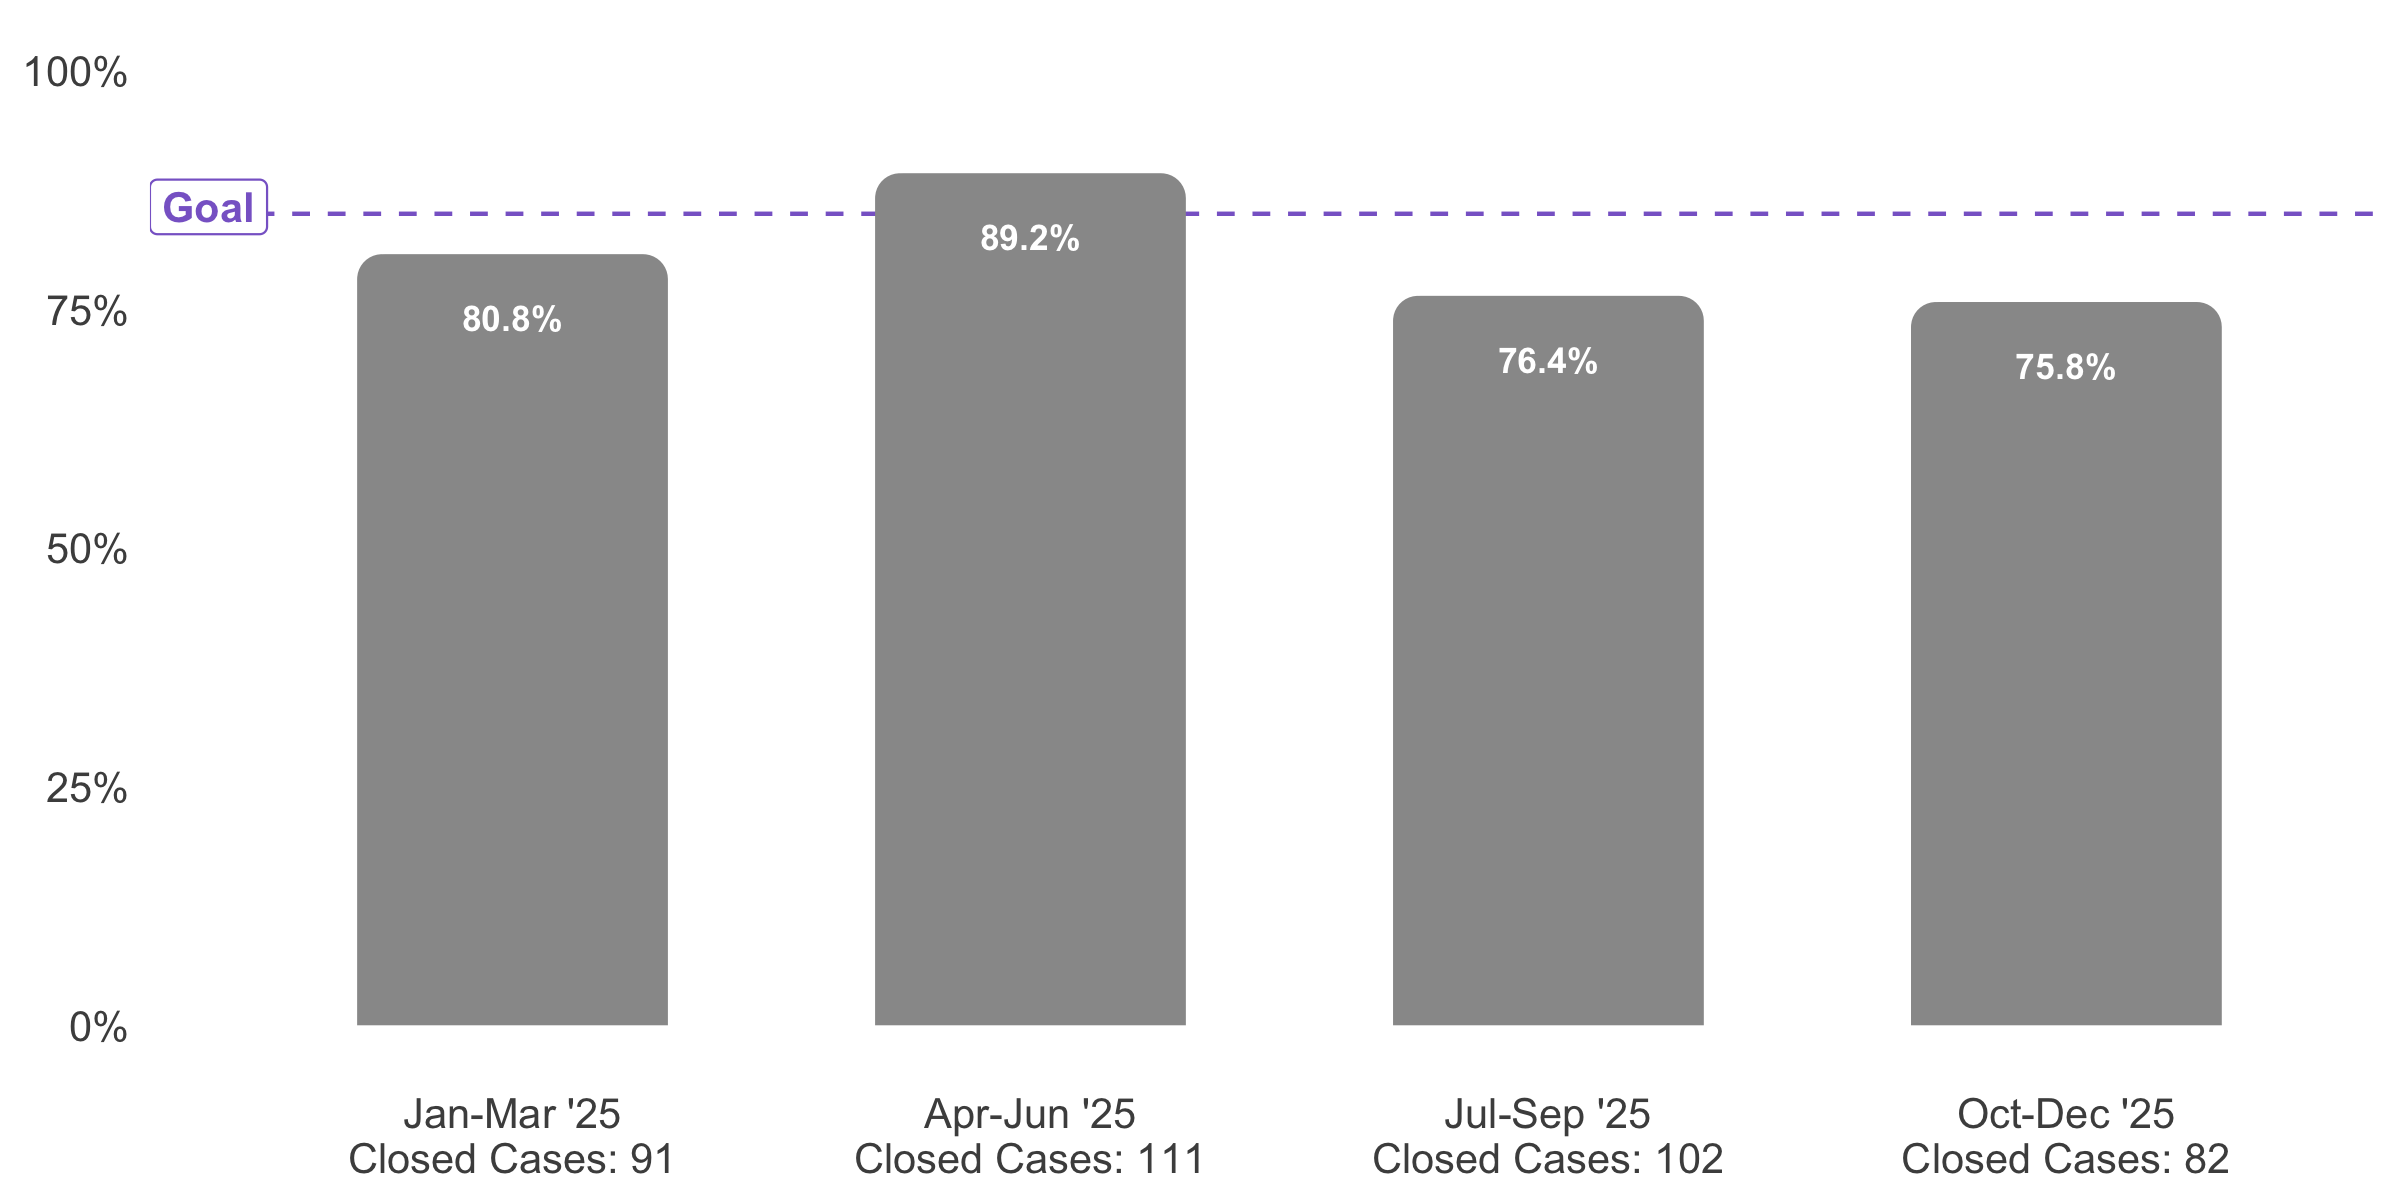
Figure 8 illustrates the share of youth having no new arrests, either when counseling finished or if treatment ended for a reason within the therapist’s control. During this reporting period, that number remained 76%, with 10% of youth law violation statuses unknown.
Demographic Information
Table 2. Reported Age, Gender, and Race of Youth Receiving Treatment from October to December 2025
| Characteristic | n | % |
|---|---|---|
| Age | ||
| 10-13 | 57 | 29.1 |
| 14-16 | 97 | 49.5 |
| 17-19 | 41 | 20.9 |
| Unknown | 1 | 0.5 |
| Gender | ||
| Female | 90 | 45.9 |
| Male | 102 | 52.0 |
| Nonbinary, self-described, or other | 4 | 2.0 |
| Race | ||
| Bi-Racial | 15 | 7.7 |
| Black | 50 | 25.5 |
| Spanish origin, Hispanic, or Latino | 8 | 4.1 |
| Unknown or other | 22 | 11.2 |
| White | 101 | 51.5 |
Appendix
Statement of Purpose
Functional Family Therapy (FFT) is an evidence-based program (EBP) for youth ages 11-18 exhibiting behavioral or emotional problems and their families. The current report is prepared by the Center for Evidence-based Partnerships in Virginia (CEP-Va) and presents relevant fidelity and outcome data in Virginia per the Family First Prevention Services Act (FFPSA) from October 1, 2025, through December 31, 2025.
The CEP-Va Fidelity Model for FFT
CEP-Va has developed fidelity and outcome models for fidelity reporting for all evidence-based programs in the Family First Prevention Plan developed by Virginia’s Department of Social Services (VDSS) and approved by the Administration for Children and Families. For each model, we used the empirical literature and recommendations from the treatment developer. Pragmatic issues were also considered when developing the models, including data availability and burden on provider companies, practitioners, and/or families. All final models were approved by the EBP developer or the EBP training company selected by VDSS. Model is detailed here.